
A relevant parameter when looking at sequencing and alignment quality is the edit distance to the reference genome, roughly equivalent to the accuracy of the reads. (Roughly, because we ignore true variants between the sample and reference). The edit distance or Levenshtein distance can be defined as the number of single letter (nucleotide) changes that have to be made to one string (read) for it to be equal to another string (reference genome). Since the error profile of Nanopore sequencing is dominated by insertions and deletions, the edit distance isn’t just the number of single nucleotide mismatches.
This technology results in a wide range of read lengths, therefore I scale the edit distance to the length of the aligned fragment. Longer reads shouldn’t get penalised more than shorter reads. It’s important to take the alignment length and not the read length since the ends of reads can be clipped substantially by the aligner, sometimes tens of kb. The experiments below were done using MinION data from the human genome in a bottle sample NA12878.
My scripts are in Python, so I’ll add some code snippets to this post. For parsing bam files and extracting the relevant bits of information, I use pysam which is pretty convenient and well-documented. Those snippets are not the full script, but just a minimal example to get the job done. A full example of the code is at the bottom of the post.
Getting this information from an alignment done using bwa mem is trivial since bwa sets the NM bam tag which is an integer with precisely what I need: the edit distance. A function to extract the NM tag using a list comprehension is added below.
This file contains bidirectional Unicode text that may be interpreted or compiled differently than what appears below. To review, open the file in an editor that reveals hidden Unicode characters.
Learn more about bidirectional Unicode characters
| import pysam | |
| def extractNMFromBam(bam): | |
| ''' | |
| loop over a bam file and get the edit distance to the reference genome | |
| stored in the NM tag | |
| scale by aligned read length | |
| ''' | |
| samfile = pysam.AlignmentFile(bam, "rb") | |
| return [read.get_tag("NM")/read.query_alignment_length for read in samfile.fetch()] |
For aligners such as GraphMap this is less trivial since the NM tag is not set. However, another tag comes to the rescue: the MD tag, which stores a string containing matching numbers of nucleotides and non-matching nucleotides. Interesting information about the MD tag can be found here. I found it a quite tough representation of the read to wrap my head around, which resulted in some wrong interpretations.
My first naive implementation counted the number of matching nucleotides (the integers in the MD string) and subtracted those matches from the total alignment length to get the number of mismatched nucleotides. The list comprehension is quite long, but essentially I split the MD string on all occurrences of A, C, T, G or ^ (indicating a deletion) and sum the obtained integers. This sum is subtracted from the aligned read length and divided by the same.
This file contains bidirectional Unicode text that may be interpreted or compiled differently than what appears below. To review, open the file in an editor that reveals hidden Unicode characters.
Learn more about bidirectional Unicode characters
| import pysam | |
| import re | |
| def extractMDFromBam(bam): | |
| ''' | |
| loop over a bam file and get the edit distance to the reference genome | |
| mismatches are stored in the MD tag | |
| scale by aligned read length | |
| ''' | |
| samfile = pysam.AlignmentFile(bam, "rb") | |
| return [(read.query_alignment_length – sum([int(item) for item in re.split('[ACTG^]', read.get_tag("MD")) if not item == '']))/read.query_alignment_length for read in samfile.fetch()] | |
As a sanity check I looped over a bwa mem aligned bam file to extract both the scaled NM tag and scaled MD-derived edit distance and plot those against each other, for which you can see the code below followed by the images. Between gathering the information from the bam file in lists and plotting the data I convert my lists to a numpy array and create a pandas DataFrame (see bottom of post). Since the first plot is rather overcrowded I also added a kernel density estimation to get a better idea of the density of the dots.
This file contains bidirectional Unicode text that may be interpreted or compiled differently than what appears below. To review, open the file in an editor that reveals hidden Unicode characters.
Learn more about bidirectional Unicode characters
| import seaborn as sns | |
| import numpy as np | |
| import pandas as pd | |
| import matplotlib.pyplot as plt | |
| from scipy import stats | |
| def makePlot(datadf): | |
| plot = sns.jointplot( | |
| x='editDistancesNM', | |
| y='editDistancesMD', | |
| data=datadf, | |
| kind="scatter", | |
| color="#4CB391", | |
| stat_func=stats.pearsonr, | |
| space=0, | |
| joint_kws={"s": 1}, | |
| size=10) | |
| plot.savefig('EditDistancesCompared_scatter.png', format='png', dpi=1000) | |
| plot = sns.jointplot( | |
| x='editDistancesNM', | |
| y='editDistancesMD', | |
| data=datadf, | |
| kind="kde", | |
| color="#4CB391", | |
| stat_func=stats.pearsonr, | |
| space=0, | |
| size=10) | |
| plot.savefig('EditDistancesCompared_kde.png', format='png', dpi=1000) |


The Pearson correlation coefficient is not too bad, but obviously, we want to get exactly the same as the NM tag. It’s clear that my implementation of getting the edit distance from the MD tag returns an underestimation of the edit distance. After thinking a while I decided to create a question on biostars where Santosh Anand joined my quest. He suggested counting the mismatches in the MD string, rather than the matches, which I implemented below. So this time I split the MD string on all numbers and sum the length of the mismatched nucleotides. The plots obtained by this approach are shown below the code.
This file contains bidirectional Unicode text that may be interpreted or compiled differently than what appears below. To review, open the file in an editor that reveals hidden Unicode characters.
Learn more about bidirectional Unicode characters
| import pysam | |
| import re | |
| def extractMDFromBam(bam): | |
| ''' | |
| loop over a bam file and get the edit distance to the reference genome | |
| mismatches are stored in the MD tag | |
| scale by aligned read length | |
| ''' | |
| samfile = pysam.AlignmentFile(bam, "rb") | |
| return [sum([len(item) for item in re.split('[0-9^]', read.get_tag("MD"))]) / read.query_alignment_length for read in samfile.fetch()] | |


That’s an improvement, but we’re not yet there. At this point Santosh asked for a few examples of reads which showed a clear deviation in NM and MD-derived edit distance. I wrote a function to do just that, which prints out:
- The NM tag
- The MD tag derived edit distance
- The MD tag
- The CIGAR string
This file contains bidirectional Unicode text that may be interpreted or compiled differently than what appears below. To review, open the file in an editor that reveals hidden Unicode characters.
Learn more about bidirectional Unicode characters
| import sys | |
| import re | |
| import pysam | |
| def extractDisagreement(bam): | |
| samfile = pysam.AlignmentFile(bam, "rb") | |
| for read in samfile.fetch(): | |
| NMdef = read.get_tag("NM")/read.query_alignment_length | |
| MDdef = sum([len(item) for item in re.split('[0-9^]', read.get_tag("MD"))])/read.query_alignment_length | |
| if NMdef – MDdef > 0.2: | |
| print('\t'.join( | |
| [ | |
| str(read.get_tag("NM")), | |
| str(sum([len(item) for item in re.split('[0-9^]', read.get_tag("MD"))])), | |
| read.get_tag("MD"), | |
| read.cigarstring, | |
| ]) | |
| ) |
This is an example of a read showing a clear mismatch between the NM tag and the MD-derived edit distance.
73
34
21G1C3A1T1A2G4A8T2G4A2G0G0G19^G2G10T6C1A2A0G0G0A5T6^GA5A0G0C0C1G3A5A6C1C2
1684H20M3I7M3I10M1I5M2I1M1I1M3I6M1I4M1I13M2I5M4I3M7I6M1D6M2I1M2I26M1I3M1I2M1I3M2D16M1I6M3I10M10942H
The hero on my quest then found that we were still missing the insertions, which are not present in the MD tag but can only be counted by parsing the CIGAR string. I copied the image below from his post.

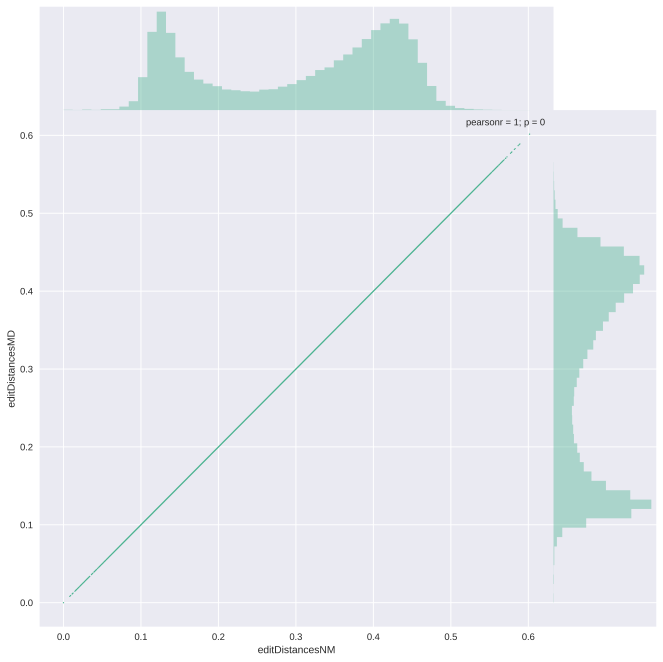
So my successful implementation also parses the CIGAR string to get the insertions and add those to the mismatches. In my final code piece below I show the full code of my evaluation of the edit distances, including some multiprocessing code to process chromosomes in parallel and converting the lists to numpy arrays in a pandas DataFrame.
The kernel density estimate plot crashes on an exact correlation, so this time you only get the scatter plot. Problem solved and everyone lived happily ever after.
Big thanks to Santosh Anand!
This file contains bidirectional Unicode text that may be interpreted or compiled differently than what appears below. To review, open the file in an editor that reveals hidden Unicode characters.
Learn more about bidirectional Unicode characters
| import sys | |
| import os | |
| import re | |
| import seaborn as sns | |
| import pandas as pd | |
| import numpy as np | |
| from multiprocessing import Pool | |
| from scipy import stats | |
| import matplotlib.pyplot as plt | |
| import pysam | |
| def processBam(bam): | |
| ''' | |
| Processing function: calls pool of worker functions | |
| to extract from a bam file two definitions of the edit distances to the reference genome scaled by read length | |
| Returned in a pandas DataFrame | |
| ''' | |
| samfile = pysam.AlignmentFile(bam, "rb") | |
| if not samfile.has_index(): | |
| pysam.index(bam) | |
| samfile = pysam.AlignmentFile(bam, "rb") # Need to reload the samfile after creating index | |
| chromosomes = samfile.references | |
| datadf = pd.DataFrame() | |
| pool = Pool(processes=12) | |
| params = zip([bam]*len(chromosomes), chromosomes) | |
| try: | |
| output = [results for results in pool.imap(extractFromBam, params)] | |
| except KeyboardInterrupt: | |
| print("Terminating worker threads") | |
| pool.terminate() | |
| pool.join() | |
| sys.exit() | |
| datadf["editDistancesNM"] = np.array([x for y in [elem[0] for elem in output] for x in y]) | |
| datadf["editDistancesMD"] = np.array([x for y in [elem[1] for elem in output] for x in y]) | |
| return datadf | |
| def extractFromBam(params): | |
| ''' | |
| Worker function per chromosome | |
| loop over a bam file and create tuple with lists containing metrics: | |
| two definitions of the edit distances to the reference genome scaled by aligned read length | |
| ''' | |
| bam, chromosome = params | |
| samfile = pysam.AlignmentFile(bam, "rb") | |
| editDistancesNM = [] | |
| editDistancesMD = [] | |
| for read in samfile.fetch(reference=chromosome, multiple_iterators=True): | |
| editDistancesNM.append(read.get_tag("NM")/read.query_alignment_length) | |
| editDistancesMD.append( | |
| (sum([len(item) for item in re.split('[0-9^]', read.get_tag("MD"))]) + # Parse MD string to get mismatches/deletions | |
| sum([item[1] for item in read.cigartuples if item[0] == 1])) # Parse cigar to get insertions | |
| /read.query_alignment_length) | |
| return (editDistancesNM, editDistancesMD) | |
| def makePlot(datadf): | |
| try: | |
| plot = sns.jointplot( | |
| x='editDistancesNM', | |
| y='editDistancesMD', | |
| data=datadf, | |
| kind="kde", | |
| color="#4CB391", | |
| stat_func=stats.pearsonr, | |
| space=0, | |
| size=10) | |
| plot.savefig('EditDistancesCompared_kde.png', format='png', dpi=1000) | |
| except: # throws an error with perfect correlation! 😀 | |
| pass | |
| plot = sns.jointplot( | |
| x='editDistancesNM', | |
| y='editDistancesMD', | |
| data=datadf, | |
| kind="scatter", | |
| color="#4CB391", | |
| stat_func=stats.pearsonr, | |
| space=0, | |
| joint_kws={"s": 1}, | |
| size=10) | |
| plot.savefig('EditDistancesCompared_scatter.png', format='png', dpi=1000) | |
| df = processBam(sys.argv[1]) | |
| makePlot(df) |

Thanks for the great function! I am going to try it on Bowtie2-mapped bams
LikeLiked by 1 person
Thanks for the very informative post.
I am a bit confused by this line of code:
Specificially, what is the ‘In In b’ part?
Thanks again.
LikeLike
Thanks for your question. I have no idea how that “ln ln b” ended up there, it totally shouldn’t be in the code and I’ll remove it.
Cheers,
Wouter
LikeLike