
A recent switch in Oxford Nanopore basecaller software (albacore v1.0.1) substantially improved the per-base quality scores, as mentioned in a previous post. I wondered if those quality scores are accurate. As shown below, the average base quality of a read is above 16. These scores are Phred-scaled quality scores, meaning they correspond to the -10*log10(Probability of incorrect base call). As such, a Phred score of 10 indicates a 1/10 probability of an incorrect base or a 90% accuracy. See also this page on Wikipedia. Similarly, a score of 16 indicates an accuracy of ~97.49%.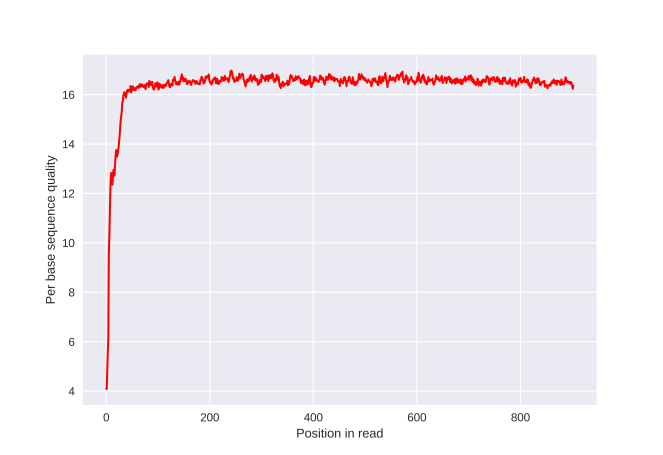
A proxy for the accuracy of the technology would be the percent identity of a sample aligned to the reference genome, implying that we assume that our sample is sufficiently similar to the reference genome. Obviously, this individual will have differences due to polymorphisms. The Genome of the Netherlands Project identified roughly 3M variants per individual, which is not too far from an earlier study on fewer individuals. Therefore, considering a 3.2Gb genome, the upper limit of the percent identity is about 99.9%.
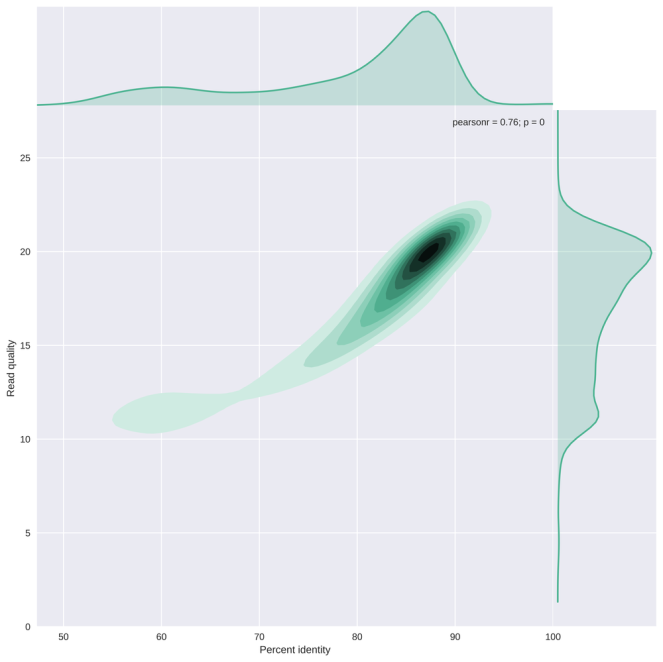
Shown below is one of the plots created by NanoPlot, plotting the per read average basecall quality versus its percent identity. The data used here is from the Cliveome, generated in November 2016. The basecalling was repeated with the most recent Albacore version, followed by alignment to GRCh37 with bwa mem -x ont2d. This plot shows there is a considerable spread on both the percent identity and average basecall quality, with a reasonable correlation between the two as expected. Most reads are situated at an average read quality of 20, with a percent identity of approximately 88%. But a score of 20 would mean an accuracy of 99%, so this is clearly an overconfident quality score.

Have you ever plotted this as median read quality vs identity?
LikeLike
nevermind, just saw your more recent post…
LikeLike
As you saw I did compare median with mean, but not directly median with percent identity. Median will probably give a better estimate of identity than average.
LikeLike
Nice plot! Just a very basic question: does nanopore base quality to phred score conversion follows the same equation as Illumina’s? e.g. phred score = ascii(base quality as in the fastq file) – 32. Thank you!
LikeLike
Hi Sharon,
Nanopore quality scores follow the Sanger system: Phred quality scores from 0 to 93 using ASCII 33 to 126. https://en.wikipedia.org/wiki/FASTQ_format#Encoding
So that would be Phred score = ascii(base quality score) – 33
Cheers,
Wouter
LikeLike
Perfect! Thank you Wouter!
LikeLike