
I recently wrote NanoFilt, a script for filtering and trimming of Oxford Nanopore sequencing data. The script reads from stdin, performs trimming and sends output to stdout. As such it can easily get integrated into your pipeline using pipes. All parameters are optional, so the reads are left unchanged when no flags are set.
Filtering can be done based on the minimal average quality of the read or on the minimal read length. After filtering the read can get cropped from the beginning or from the end for a specified number of bases.
Installation
The Python script can be installed with pip:
pip install nanofilt
The script is written for Python3, but might as well work for Python2.7 although I haven’t tested that.
Usage
NanoFilt [-h] [-q QUALITY] [-l LENGTH] [--headcrop HEADCROP] [--tailcrop TAILCROP]

optional arguments:
-h, --help show this help message and exit
-q, --quality QUALITY Filter on a minimum average read quality score
-l, --length LENGTH Filter on a minimum read length
--headcrop HEADCROP Trim n nucleotides from start of read
--tailcrop TAILCROP Trim n nucleotides from end of read
Example usage
zcat reads.fastq.gz | NanoFilt -q 10 -l 500 --headcrop 50 | bwa mem -t 48 -x ont2d genome.fa - | samtools sort -O BAM -@24 -o alignment.bam -
zcat reads.fastq.gz | NanoFilt -q 12 --headcrop 75 | gzip > trimmed-reads.fastq.gz
Rationale
My plots in a previous post suggested that trimming about 50 nucleotides from the beginning of a read can be beneficial since those show a biased content of nucleotide distribution and a substantially lower quality.
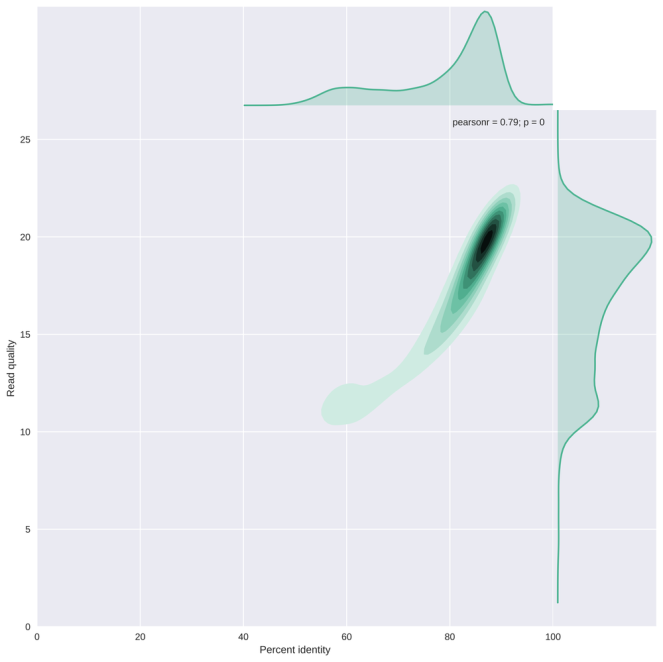
The plot below (from my NanoPlot gallery) shows the correlation between average read basecall quality and the edit distance to the reference genome scaled by read length (or the percent identity). This result suggests that reads with an average quality score below 13-15 have a striking lower percent identity. It may be important to remove those, depending on your application.
As always, I welcome all suggestions, feedback and feature requests!

Hi. Quick question for you – which read quality metric are you using – the Nanopore one, or something else? Thanks!
LikeLike
Hi Roberto,
The read quality used by NanoFilt is the average of all Phred basecall quality scores of the read. Those quality scores are from basecalling by albacore (or MinKNOW).
Hope that answers your question.
Cheers,
Wouter
LikeLike
Hi !
I’ve got a question for you. I just basecalled 9500 reads with Albacore. When I use the related sequencing_summary.txt and sort the reads by mean q-score, I see that I should have about 7000 with a Q-score >8.
Now when I use NanoFilt with this Q-score threshold, I’ve got 9200 reads coming back.
Do you have an idea of what is going wrong here ?
Thank you very much !
Anne-lise
LikeLike
Hi Anne-lise,
That difference is related to my latest post (https://gigabaseorgigabyte.wordpress.com/2017/06/26/averaging-basecall-quality-scores-the-right-way/). Upgrading your nanomath installation should solve this (pip install nanomath –upgrade).
In short, quality scores were calculated differently from fastq file compared to albacore, but that has been fixed now.
Cheers,
Wouter
LikeLiked by 1 person
Amazing ! Thank you !
LikeLiked by 1 person
Is there a way to use a file that is not zipped? Such as
bash$ Nanofilt file.fa -l 500 -q 9 > file.filter.fa
LikeLike
Yes, if you just use “cat yourfile.fastq | NanoFilt etc” that should work. But not on a fasta file, currently.
LikeLike
Also need to use pip3 on the install
LikeLike
Yes, requires Python3. So if you have multiple python installations then you need pip3
LikeLike
Hi Wouter,
I’ve been using NanoFilt for removing low quality reads in PacBio data – it works well for single files. Any idea how I could apply it to a directory of fastq files?
Thanks for the tool!
Ant
LikeLike
Hi Ant,
You have a couple of options for working on multiple files. I assume your files are not compressed, but you can modify the commands below to take care of compressed data.
You could pipe them all through NanoFilt and generate one output file only:
cat *.fastq | NanoFilt ... > new_output.fastqThis is going to be the slowest option, but perhaps the cleanest.
Note that you could also pipe directly to an aligner:
cat *.fastq | NanoFilt ... | minimap2 -a genome.fa | samtools sort -o new_output.bamYou could use a bash loop and process them sequentially:
for fq in *.fastq
  do
    cat $fq | NanoFilt ... > filtered_${fq}
  done
You could use gnu parallel, with a certain number of simultaneous jobs (8 in my example)
ls *.fastq | parallel -j 8 'cat {} | NanoFilt > filtered_{}'Hope that helps.
Cheers,
Wouter
LikeLike
The last solution did exactly what I wanted,
Thanks very much!
Ant
LikeLike
I had written my own Python Script for trimming the 5′ end and filtering on length and mean Qscore. I started with data that ranged from Q10 to Q30. When I ran NanoFilt to trim off the first 10 bases filter on >=1000 and Q>=11 I lost half the reads, and the FastQC plot was a bell curve from Q18-Q29. With my script I get the same curve as for all the data but just missing the portion of the curve below Qscore 11.
LikeLike
There is indeed a difference between how my tools and others, including FastQC, calculate the average quality score of a read, as also reported here: https://github.com/wdecoster/NanoPlot/issues/191 Please see this blog post for a discussion on how to average quality scores correctly: https://gigabaseorgigabyte.wordpress.com/2017/06/26/averaging-basecall-quality-scores-the-right-way/
LikeLike
That all makes sense, and certainly explains the issue. I had used qmean = mean(rectemp.letter_annotations[“phred_quality”]), that I probably stole from someone else’s code.
LikeLike